About the EEMBC TeleBench™ Performance Benchmark Suite
TeleBench is a suite of benchmarks that allows the users to approximate the performance of processors in modem and related fixed-telecom applications. Its benchmark kernels, which also serve as a representation of traditional DSP algorithms, include the following:
Autocorrelation
This benchmark, which produces scores from three different data sets – pulse, sine, and speech – is based on a mathematical tool used frequently in signal processing for analyzing functions or series of values, such as time domain signals. It is the cross-correlation of a signal with itself.
Convolutional Encoder
This benchmark supports a type of error-correcting code and is based on an algorithm often used to improve the performance of digital radio, mobile phones, satellite links, and Bluetooth implementations.
Bit Allocation
The benchmark tests the target processor’s ability to spread a stream of data over a series of buffers (or “frequency bins”) which it then modulates and transmits on a telephone line in ADSL applications.
Inverse Fast Fourier Transform (iFFT)
The benchmark tests the target processor’s ability to convert frequency domain data into time domain data.
Fast Fourier Transform (FFT)
The benchmark tests the target processor’s ability to convert time domain data into frequency domain data.
Viterbi Decoder
The benchmark tests the processor’s ability to recover an output data packet from an encoded input data packet in embedded IS-136 channel coding applications.
TeleBench Benchmark Scores
The Telemark™ score reported for each device is a single-number figure of merit calculated by taking the geometric mean of the individual TeleBench scores and dividing by 785.13 . (This normalization factor is derived from the lowest score in this category on December 5, 2000.) Scores for each of the individual benchmarks within this suite allow designers to weight and aggregate the benchmarks to suit specific application requirements.
To calculate a geometric mean, multiply all the results of the tests together and take the nth root of the product, where n equals the number of tests.
Since the introduction of TeleBench Version 1.1, scores for approximately 60 processor/compiler combinations tested against this suite have been certified and published. View certified TeleBench benchmark scores.
Analysis
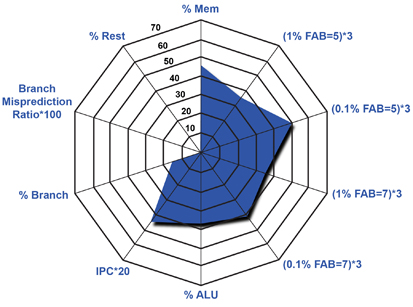
Graph of workload behavior.
EEMBC benchmark characterization data allows designers to better understand how to interpret EEMBC benchmark scores relative to certain processor characteristics. The Kiviat graph above, which visualizes multivariable data in a way that easily reveals program behavior, shows workload characteristics for the Viterbi Decoder benchmark within TeleBench 1.1.
This research study contains further information about the benchmark characteristics.
Resources
You can learn more about the components in the TeleBench Data Book.
GitHub
TeleBench is available on GitHub.