About the EEMBC Networking Performance Benchmark Suite
Networking Version 2.0 is a suite of benchmarks that allow users to approximate the performance of processors tasked with moving packets in networking applications. Networking Version 2.0 expands on Version 1.1 by enhancing the existing benchmarks and adding new benchmarks to the mix. Delivering realistically large data sets and more transactions, Networking Version 2.0 creates a level playing field for processors with large caches and those that have implemented networking optimizations or pipelines tuned for handling the types of code commonly used in networking applications.
The suite’s seven benchmark kernels cover the following operations:
IP Packet Check
The correct processing of Internet Protocol (IP) packets, whether forwarding them to another router or processing and sending them to a local machine, is a fundamental part of a network router’s workload. The first step is to validate the IP header information of all packets. The RFC1812 standard defines the requirements for packet checks carried out by IP routers, and EEMBC created its Packet Check benchmark to model a subset of the IP header validation work specified in that standard.
IP Reassembly
Packets are often fragmented before being transmitted over the Internet from one part of the network to another, and then reassembled upon arrival. Measuring a processor’s performance in reconstructing these disjointed packages is the role of the IP Reassembly benchmark.
IP Network Address Translator (NAT)
Follows NAT rules to rewrite the IP addresses and port numbers of packets based on pre-defined NAT rules. Because rewriting each packet modifies its source IP address and port chosen by the algorithm, the NAT benchmark simulates an important part of network processing for many router designs.
Route Lookup
Receives and forwards IP packets using a mechanism commonly applied to commercial network routers. It employs a data structure known as the Patricia Tree, a compact binary tree that allows fast and efficient searches with long or unbounded length strings. The benchmark monitors the processor’s ability to check the tree for the presence of a valid route and walk through the tree to find the destination node to which to forward the packet.
Open Shortest Path First (OSPF)
Implements the Dijkstra shortest path first algorithm, which is widely used in routers and other networking equipment.
Quality of Service (QOS)
As use of the Internet continues to evolve, so too does the data transmitted over it. Voice, video, and multimedia presentations provide a greater challenge than simple text and files because their timing and order are critical. Data transfer and error rates suitable to support such applications are measured by Quality of Service (QoS) processing. Bandwidth management software “shapes” traffic flows to meet QoS requirements, and EEMBC’s QoS benchmark simulates that processing.
TCP
Comprised of three components, EEMBC’s TCP benchmark is designed to reflect performance in three different network scenarios. The first component, Gigabit Ethernet (“TCP Jumbo”), represents the likely workload of Internet backbone equipment using large packet transfers. The second (“TCP Bulk”) takes the form of a standard Ethernet network, concentrating on large transfers of packets using protocols such as FTP. The last component (“TCP Mixed”) also uses a standard Ethernet network model, but focuses on the relay of mixed traffic types, including Telnet, FTP, and HTTP. The benchmark processes all of the packet queues through a server task, network channel, and client task. Simulating the data transfers through the connections reveals how the processor will realistically cope with various forms of TCP-based traffic.
Resources
You can learn more about the components in the Networking Data Book.
Networking Benchmark Scores
You can view historical scores for Networking 1.0 and 2.0.
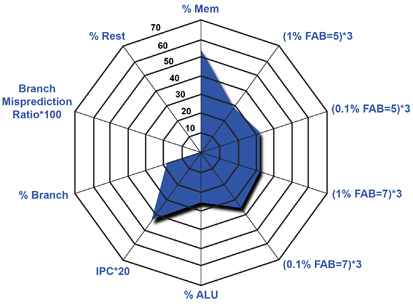
Graph of workload behavior.
EEMBC benchmark characterization data allows designers to better understand how to interpret EEMBC benchmark scores relative to certain processor characteristics. The Kiviat graph above, which visualizes multivariable data in a way that easily reveals program behavior, shows workload characteristics for the Quality of Service benchmark within Networking 2.0. This data was taken from a characterization done by North Carlonia State University.
FAQ
- For the TCP benchmark (bulk,mixed,jumbo), is a specific IP and Ethernet network stack used in your implementation? No, we only provide the TCP connection setup and teardown processing.
- For the TCP benchmark, is multi-tasking used for client/server communication? The MultiBench suite is the only EEMBC suite that uses multitasking. There are several workloads within that suite that address client/server communication.
- How does the client talk with the server in the TCP Benchmark? e.g., socket communication, or shared memory read/write? Shared memory, this benchmark only tests the processing part, not any I/O.
- How is the TCP checksum implemented? For example, is this done by software functions? If the device has hardware-assisted features for checksum calculation, how should we utilize it with the benchmark? By software. Certification rules allow for two distinct types of certification:
- Out of the box - code may not be changed
- Optimized - source code of the kernel may be changed. For the 2nd form, you are allowed to use hardware assist for offloading the checksum.